Tagged: Grounded Into Double Play
What exactly is WAR?
Let me begin by stating that I do not believe that Wins Above Replacement is a be-all and end-all statistic. I do, however, believe that along with OPS+, it is the single best measurement of a player’s value and performance, taking into account batting, baserunning, and defense. The following will examine how WAR is calculated to help determine its importance in making baseball decisions – whether they be in the front office of a MLB club or your high school pal’s fantasy keeper league.
WAR is statistical formula made up of several variables which churns out a single number to represent a player’s value to his team. The exact formula for WAR varies, as there are two main versions used – Baseball-Reference WAR (rWAR) and FanGraphs’ WAR (fWAR). In our case, we’ll examine Baseball-Reference.com WAR. The key to WAR is runs; Runs Above Average (RAA) is converted to Wins Above Average via the PythagenPat win-loss estimator. More often than not ten runs equates to one win, however, some small variations may occur. But before your head starts spinning, remember that wins are wins. A club’s total WAR, when adjusted for the replacement level, will closely mimic the actual win total of the team.

The three active leaders in career rWAR: Alex Rodriguez (111.4; 17th all-time), Albert Pujols (85.5; 40th all-time), and Chipper Jones (81.5; 49th all-time).
But what exactly is a replacement? Contrary to popular belief, the term replacement does not refer to your average Major Leaguer. Instead, it attempts to encapsulate a player stuck in baseball limbo – somewhere between AAA and the fictitious AAAA, not quite ready for The Show. According to Baseball-Reference, “Average players are relatively rare and can be expensive to acquire. Average players don’t make the league minimum.” A replacement player is just that – a stop gag. Each offseason teams spend millions on over-priced ‘average’ players. When speaking of WAR, the comparison is between Player X and the common, readily-available minor league journeyman. Replacement level equates to a .320 winning percentage. The 875 wins above replacement each year in the MLB [30 x 162 x (.500-.320)] are distributed between pitchers and position players. In conjunction with free agent salaries from the past four years, 41% of the runs are given to pitchers; hitters subsequently receive 59%. Over 650 plate appearances, players replacing league-average starters would deduct twenty runs from their team; these runs are known as the Replacement Level multiplier. For further comparison, a team comprised strictly of replacement players would win approximately 52 games in the regular season. This factor is adjusted for each league, as the AL has defeated the NL during Interleague play in eight consecutive seasons dating back to 2004.
Mike Trout’s 2012 rookie campaign yielded the highest single-season rWAR of any active player (10.7).
Defense plays a large role in WAR, so naturally the statistic is calculated differently for position players and pitchers. First, let’s look at Position Player WAR. For fielders, WAR consists of batting runs, baserunning runs, fielding runs, runs added/lost due to grounding into double plays, and positional adjustments. Each category is extremely comprehensive. Batting runs account for pre-DH seasons, estimated caught stealing totals, infield singles, strikeouts, Reached On Error, and more. Baserunning runs are more than just SB and CS; getting from 1st to 3rd on a single, scoring on a grounder, tagging up, and other key baserunning occurrences all factor in. Perhaps the most complicated and debated aspect of WAR is the value of fielding. I’m of the belief that defense is half the game, but others disagree.

Cubs’ second baseman Darwin Barney led all of baseball with 28 Defensive Runs Saved in 2012.
Since its development in 2003, Baseball Info Solutions Defensive Runs Saved (DRS) has been the default measurement for fielding runs. For seasons prior to ’03 (where observational data is non-existant), WAR used Sean Smith’s Total Zone Rating (TZR). However DRS has become “the most sophisticated public system available,” according to Baseball-Reference. Even baseball purists must appreciate the breadth and scope of DRS, which factors in dozens of potential plays (blocking a ball in the dirt, robbing a homerun, misplaying the outfield wall…) as well as a fielder’s range based on batted ball velocity, an outfielder’s arm strength based on the number of runners he allowed to advance, an infielders double play conversion rate, fielding success on bunts, stolen base conversion rate, and even pitch framing and game management for catchers. An overlooked factor of WAR is GIDP, or Grounded Into Double Play. Left-handed hitters such as Ichiro can fly out of the batter’s box and be half-way down the line in the blink of an eye. This gives lefties a decidedly large advantage over right-handed hitters. Beating out a potential double play takes skill and hustle. On average, the difference between avoiding and grounding into a double play is .44 runs (Baseball-Reference).

Ichiro’s speed and unique stance helped him lead the MLB in singles nine of his first ten seasons.
Finally, we reach positional adjustments. Teams are willing to sacrifice offense at key defensive positions such as shortstop and catcher, as demonstrated by this chart. To level the playing field, rWAR adds/subtracts runs based on your primary position. Catchers receive the biggest boost, earning ten runs, or roughly one win, per 1,350 innings played (9 innings multiplied by 150 games). On the contrary, a Designated Hitter sees fifteen runs disappear from his WAR due to his lack of defending. Shortstops are awarded 7.5 runs while second basemen only gain three. Despite corner outfielders subtracting 7.5, center fielders claim an extra 2.5 runs. On the corners of the diamond, third basemen add two runs while first basemen are helplessly left watching a full victory vanish from their WAR. Not fair you say? Statistics would say otherwise.
* * *

No active pitcher has a higher career rWAR than Roy Halladay (63.1), but even he trails Cy Young by a whopping 99.2 wins for the all-time mark (162.3).
Calculating Pitcher WAR can be just as, if not more, complex than Position Player WAR. Despite the simplicity of Runs Allowed and Innings Pitched, Pitcher WAR becomes complicated when trying to determine how an average pitcher would handle certain situations. One key which calls for adjustments is the level of opposition. Remember that Giants’ pitchers never had to face Barry Bonds the year he amassed a ridiculous .609 On-Base Percentage. Interleague play muddles up the conversation even more, as away games are not counted. Baseball-Reference believes that “including nine games the Red Sox don’t have a DH will skew their offensive averages lower when most pitchers are facing them with a DH.” Makes sense to me, so I’ll allow it.
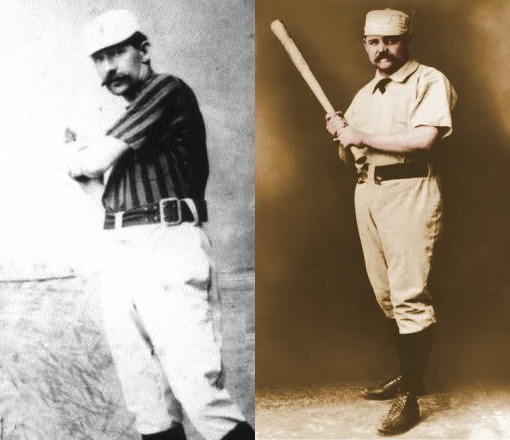
Although Pud Galvin (right) holds the record for single-season pitching rWAR (19.9 in 1884), he struggled with the stick. Tim Keefe (left) was able to pitch and hit his way to the highest single-season rWAR ever (19.5 in 1883).
This brings us to Defense-Independent Pitching Stats, more commonly known as DIPS. Within this statistic lies yet another heated debate. Should pitchers be punished for defensive errors made by their teammates? WAR is attempting to “measure the value of the recorded performance–not it’s repeatability,” so Baseball-Reference.com does take into account defense in some ways. Relievers and starters have significantly different ERA’s in today’s game, causing rWAR to adjust accordingly. Bullpen relievers became a vital part of game management in the 1960’s. From 1960-1973, rWAR sets a difference of .0583 runs/game less given up by relievers. From ’74 on, when managers started utilizing their ‘pens in a more modern fashion, the difference increases to .1125 runs/game. Also taken into account are park factors – vital for pitchers playing in the odd-ball NL West, a division with some of the very best and worst hitter’s parks in the league. Park factors are calculated using data from the three previous seasons. It is generally accepted that late innings have a higher impact on the outcome of a ballgame. To account for this a leverage multiplier is used. The average leverage is 1.0, however closers often approach averages of 2.0, while mop-up guys might check in at 0.7. This metric “is applied only for relief innings and the leverage we use in the leverage at the beginning of the pitcher’s outing. This way a bad pitcher can’t bump up his leverage by walking the bases loaded and striking out the side every time” (Baseball-Reference).
Complex enough for you? WAR attempts to leave no stone unturned, that’s why to me it’s the best measure of a player’s value.
* * *
Still confused? Click here for a comparison chart on the different versions of WAR. Also, check out the all-time career leaders for WAR.
This post is written in honor of my roommate and great friend, Lucas Gilles, the biggest anti-WAR advocate I know.
